|
 |
|
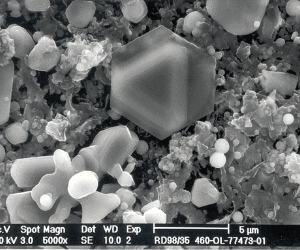
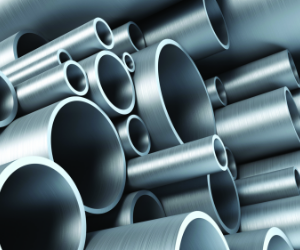
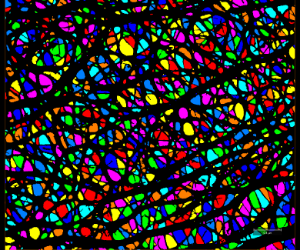
Ultra-fast analysis of inclusions in steel production samples The monitoring and management of inclusions are central to the steelmaking process and vital for organizations to ensure the appropriate quality and properties of steel products while minimizing cost. In this interview, Jean-Marc Böhlen explains some of the underlying principles of ultra-fast analysis of non-metallic micro-inclusions using the Thermo Scientific™ ARL iSpark™ Optical Emission Spectrometer. He also outlines its advantages and benefits, and details some of its applications. You can also watch the full webinar presentation, followed by a live demo of the ARL iSpark with Spark-DAT Software Suite. Furthermore, Total Material has partnered with Thermo Fisher Scientific to deliver a globally-sourced knowledge base for our ARL iSpark series optical emission spectrometer. You can obtain a free trial of this global database below. |
|
|
|
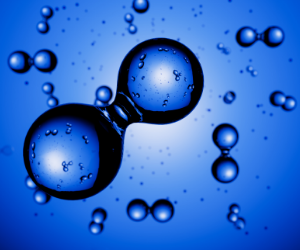
New breakthrough in FTIR gas analysis with sensitivity down to mid ppt New technology is enabling incredible improvement in low-level gas analysis processes. The Thermo Scientific™ MAX-iR™ FTIR Gas Analyzer with Thermo Scientific™ StarBoost™ Technology routinely measures contaminants down to single-digit parts per billion (ppb), and for bulk gas applications it measures down to mid parts per trillion (ppt).
The real-time measurement capability of the MAX-iR system extends beyond the lab environment and is routinely deployed in challenging environments such as ambient air or source testing. The MAX-iR software was specifically developed for process and CEM environments. It enhances productivity without human interaction, while boasting an array of desirable capabilities: | • | Fully automated method control | | • | DCS data output | | • | Remote access | | • | Reporting tools |
The MAX-iR analyzer can be combined with various application-specific platforms to transform from a stand-alone analyzer to a fully automated solution that, in the words of users, “just works!” |
|
|
|
Understanding Surface Reactions of the Solid Electrolyte Interface via Advanced Characterization Techniques Dr Charl Jafta of Oak Ridge National Laboratory will outline the characterization of solid electrolyte interphase (SEI) layers that can help develop processes for the production of artificial SEI layers. A facile non-invasive electrochemical protocol that improves the interfacial impedance and contact will be presented, while other alternatives such as extreme fast charging that produces lithium plating on graphite electrodes Li4Ti5O12 (LTO) and TiNb2O7 (TNO) will be explored. In situ thermal XPS measurements of solid polymer electrolytes will be shown, opening the question if degradation is due to the temperature or the X-ray radiation. XPS as a standalone and complimentary tool to probe battery surfaces will be discussed with other operando techniques. Attend this webinar to learn about: | • | Probing the SEI layer via operando small angle neutron scattering and using ex situ XPS as a complementary tool | | • | Evolution of the SEI via operando techniques | | • | How X-rays influence the degradation of solid polymer electrolytes |
|
|
|
|
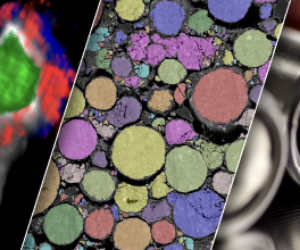
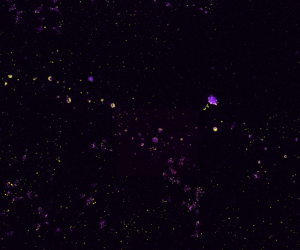
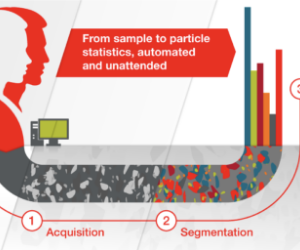
Accelerate your nanoparticle imaging and chemical analysis Nanoparticles can be found in materials in almost every modern-day industry imaginable. Their broad applicability in materials is widely due to their combination of unique chemical properties, high surface area, and nanoscale size. The quantification and characterization of chemical properties of nanoparticles within a material are crucial first steps to designing materials that are more intentionally designed, structurally stable, and safer for the public. Discover how to effectively examine statistically relevant data, no matter the nanoparticle type. |
|
|
|
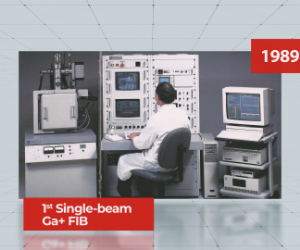
Celebrating 30+ years of TEM sample preparation innovation Sample preparation for scanning/transmission electron microscopy (S/TEM) analysis is considered to be one of the most critical but challenging and time-consuming tasks in materials characterization labs. Conventional methods used to prepare ultra-thin samples required for S/TEM are slow, typically requiring many hours or even days of effort by highly trained personnel. This process is further complicated by the variety of different materials and the need for site-specific information. For more than 30 years, Thermo Fisher Scientific has been continuously developing and optimizing sample preparation instruments and introducing software that enable in situ TEM sample preparation. Our products allow researchers to fast-track their research and accelerate innovation. In 1989, we were the ones that developed the first single-beam Ga+ FIB, allowing sub-microscale site-specific material removal. See how TEM sample preparation has progressed over the past 30 years. |
|
|